

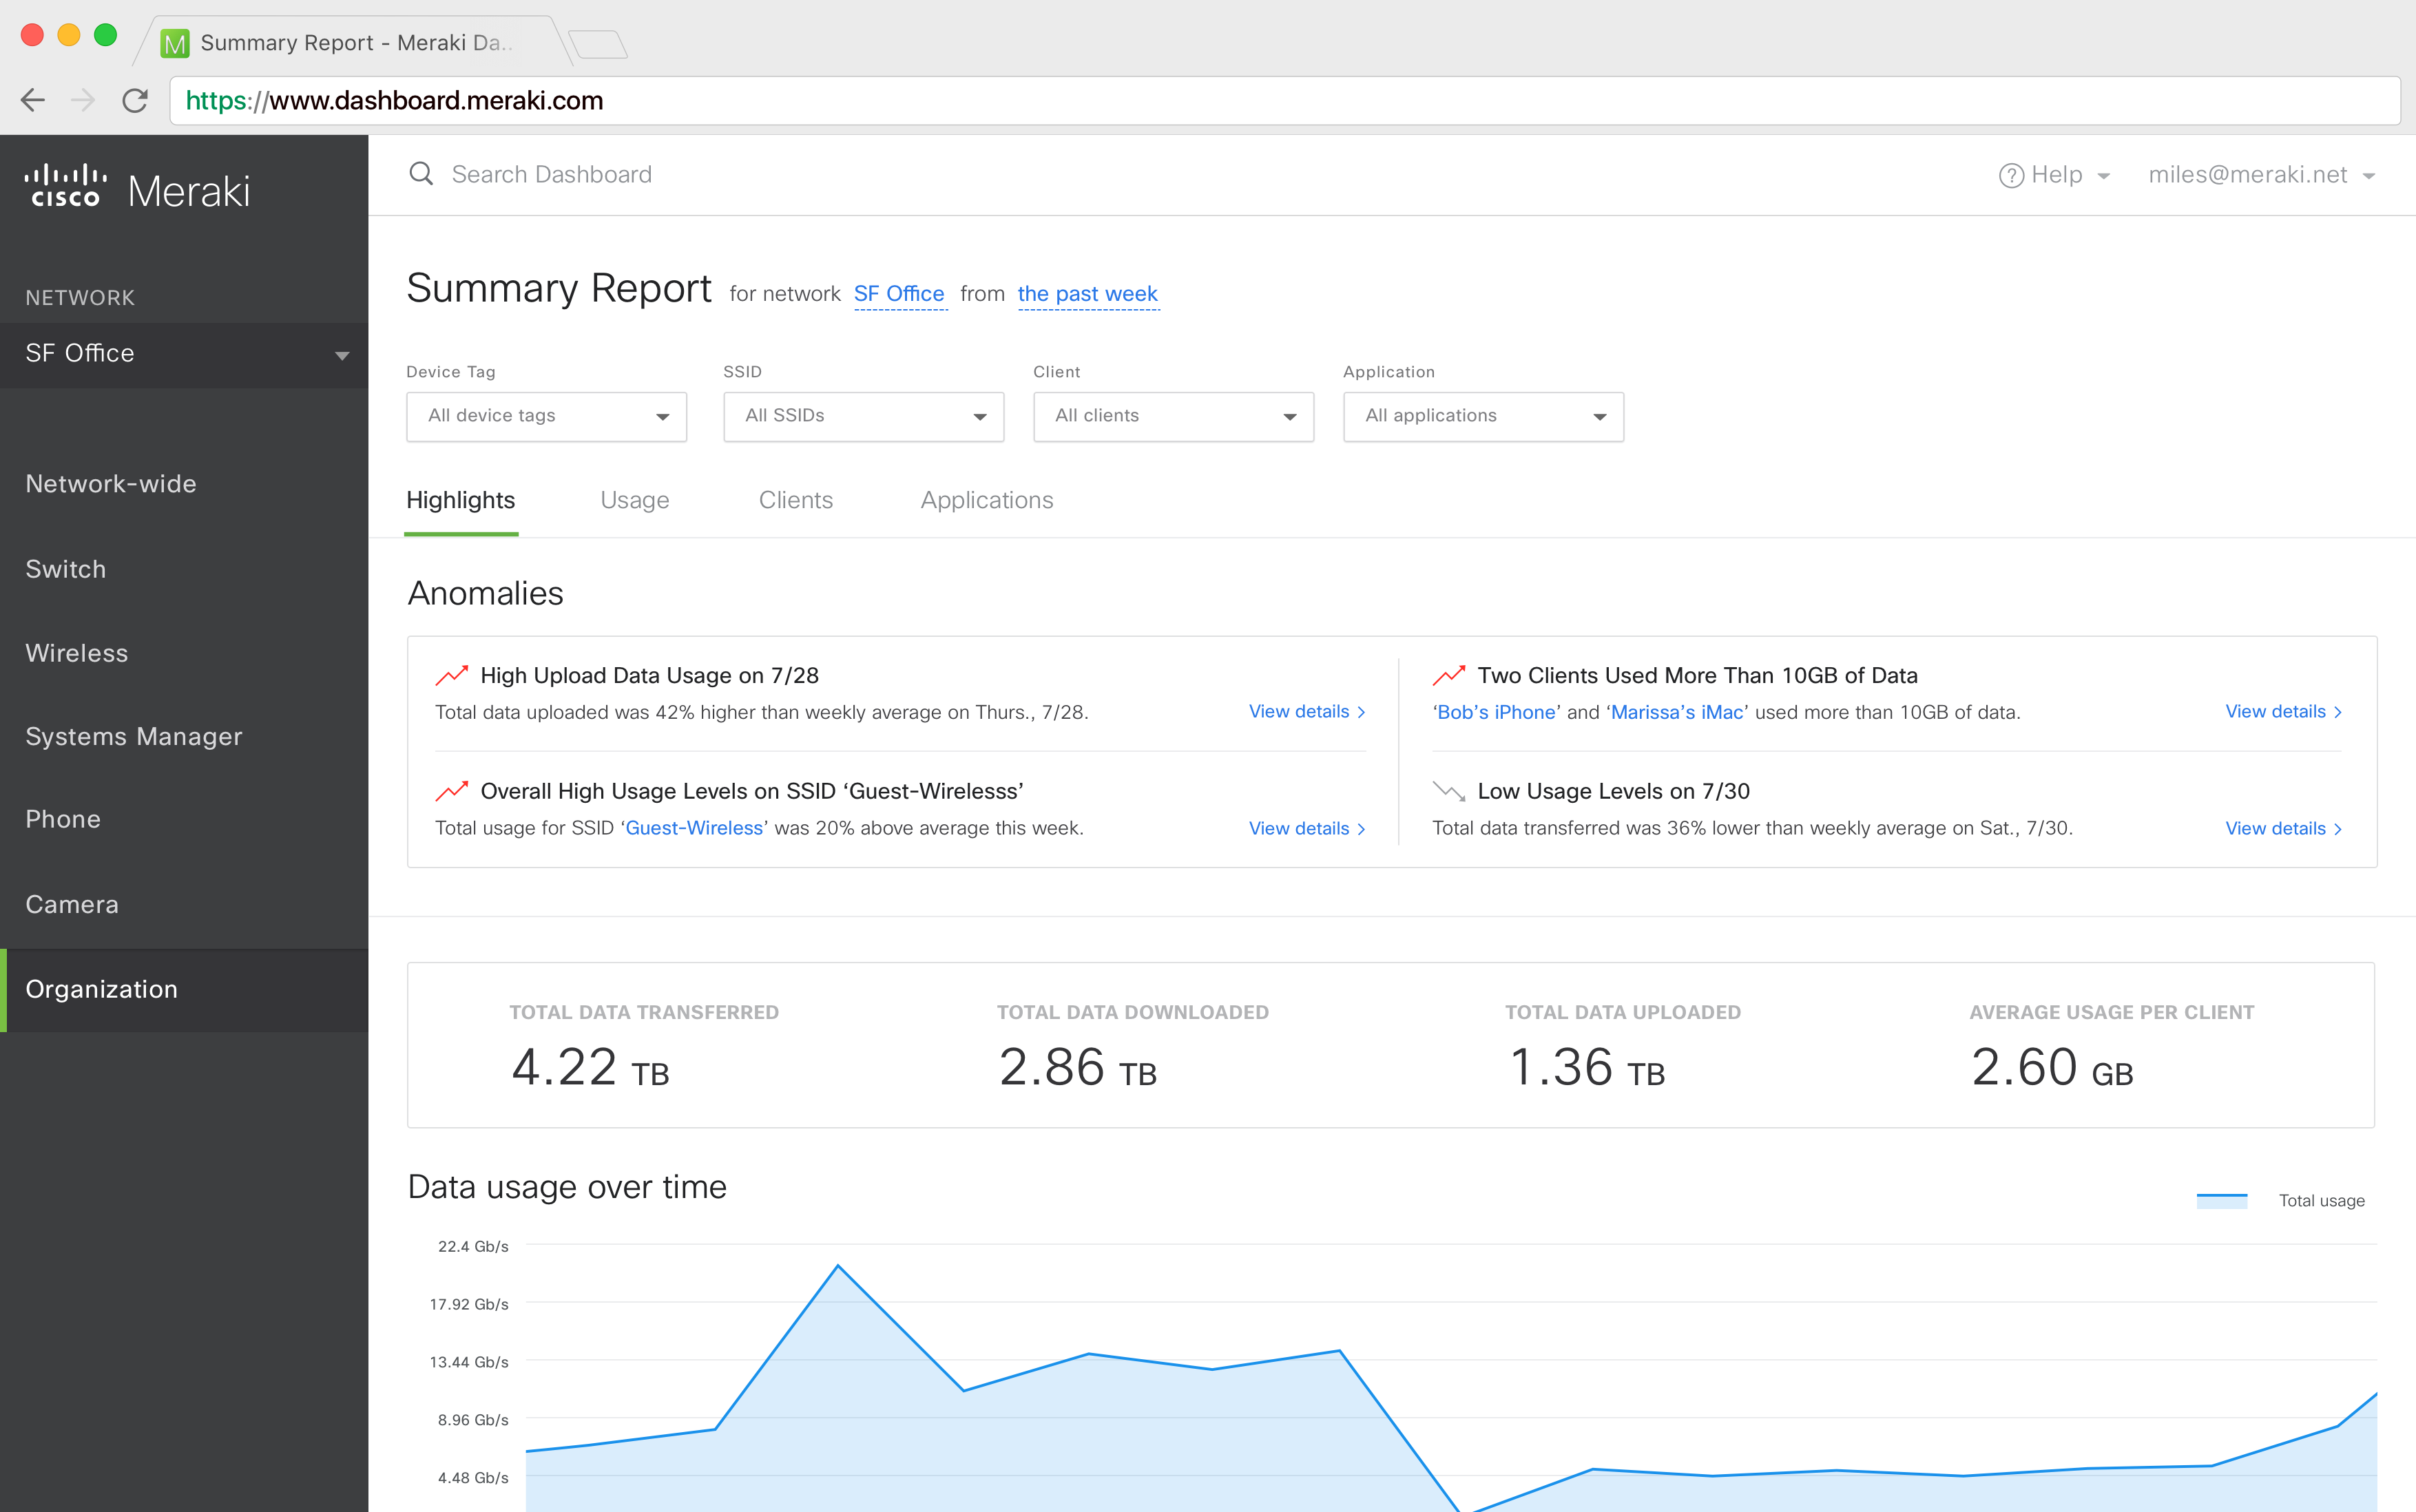
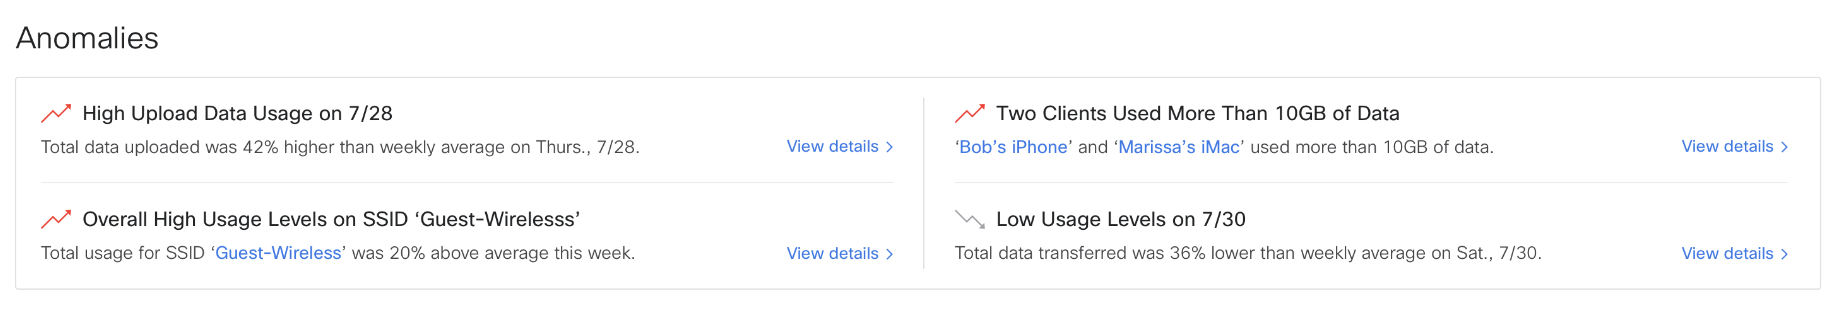
Anomalies monitor an organization's network in real-time, proactively alerting IT professionals to any abnormal behavior, with recommendations on how to resolve or optimize issues.
More than 802,000+ enterprise networks rely on Cisco Meraki's cloud network to keep their business running. The Meraki Dashboard allows network administrators to monitor and control applications, users and devices in real time. I was tasked with understanding how network admins use reporting data on Dashboard, particularly on the Summary Report page. I worked on the research, interaction design, visual design and front-end development.
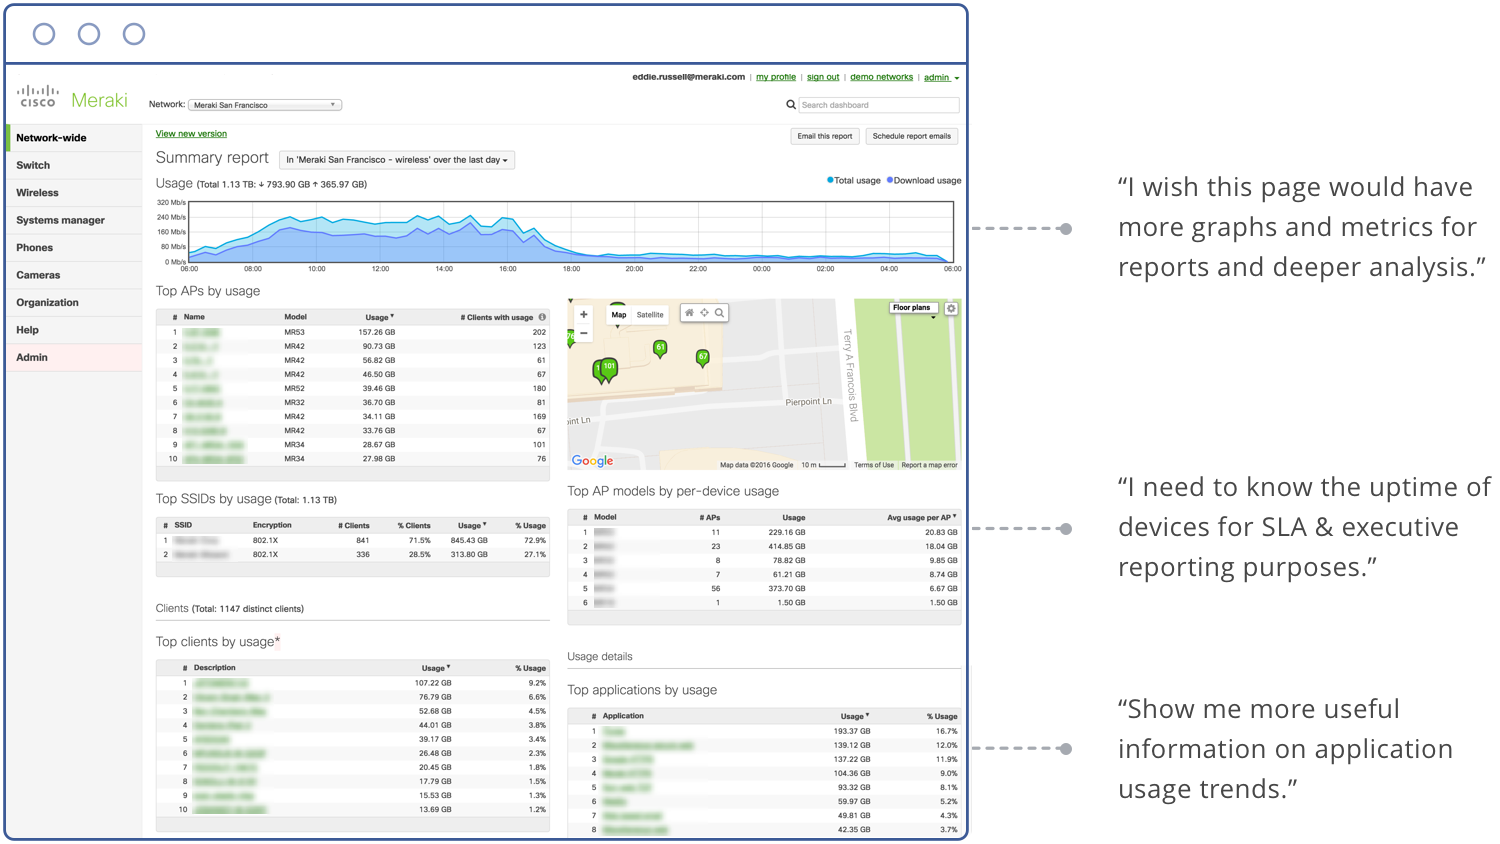
I partnered with an engineer and one other designer to understand how customers use the current Summary Report page. Together, we interviewed 14 users from varied industries and organization size. Here's a few key insights we uncovered:

Iteration 1
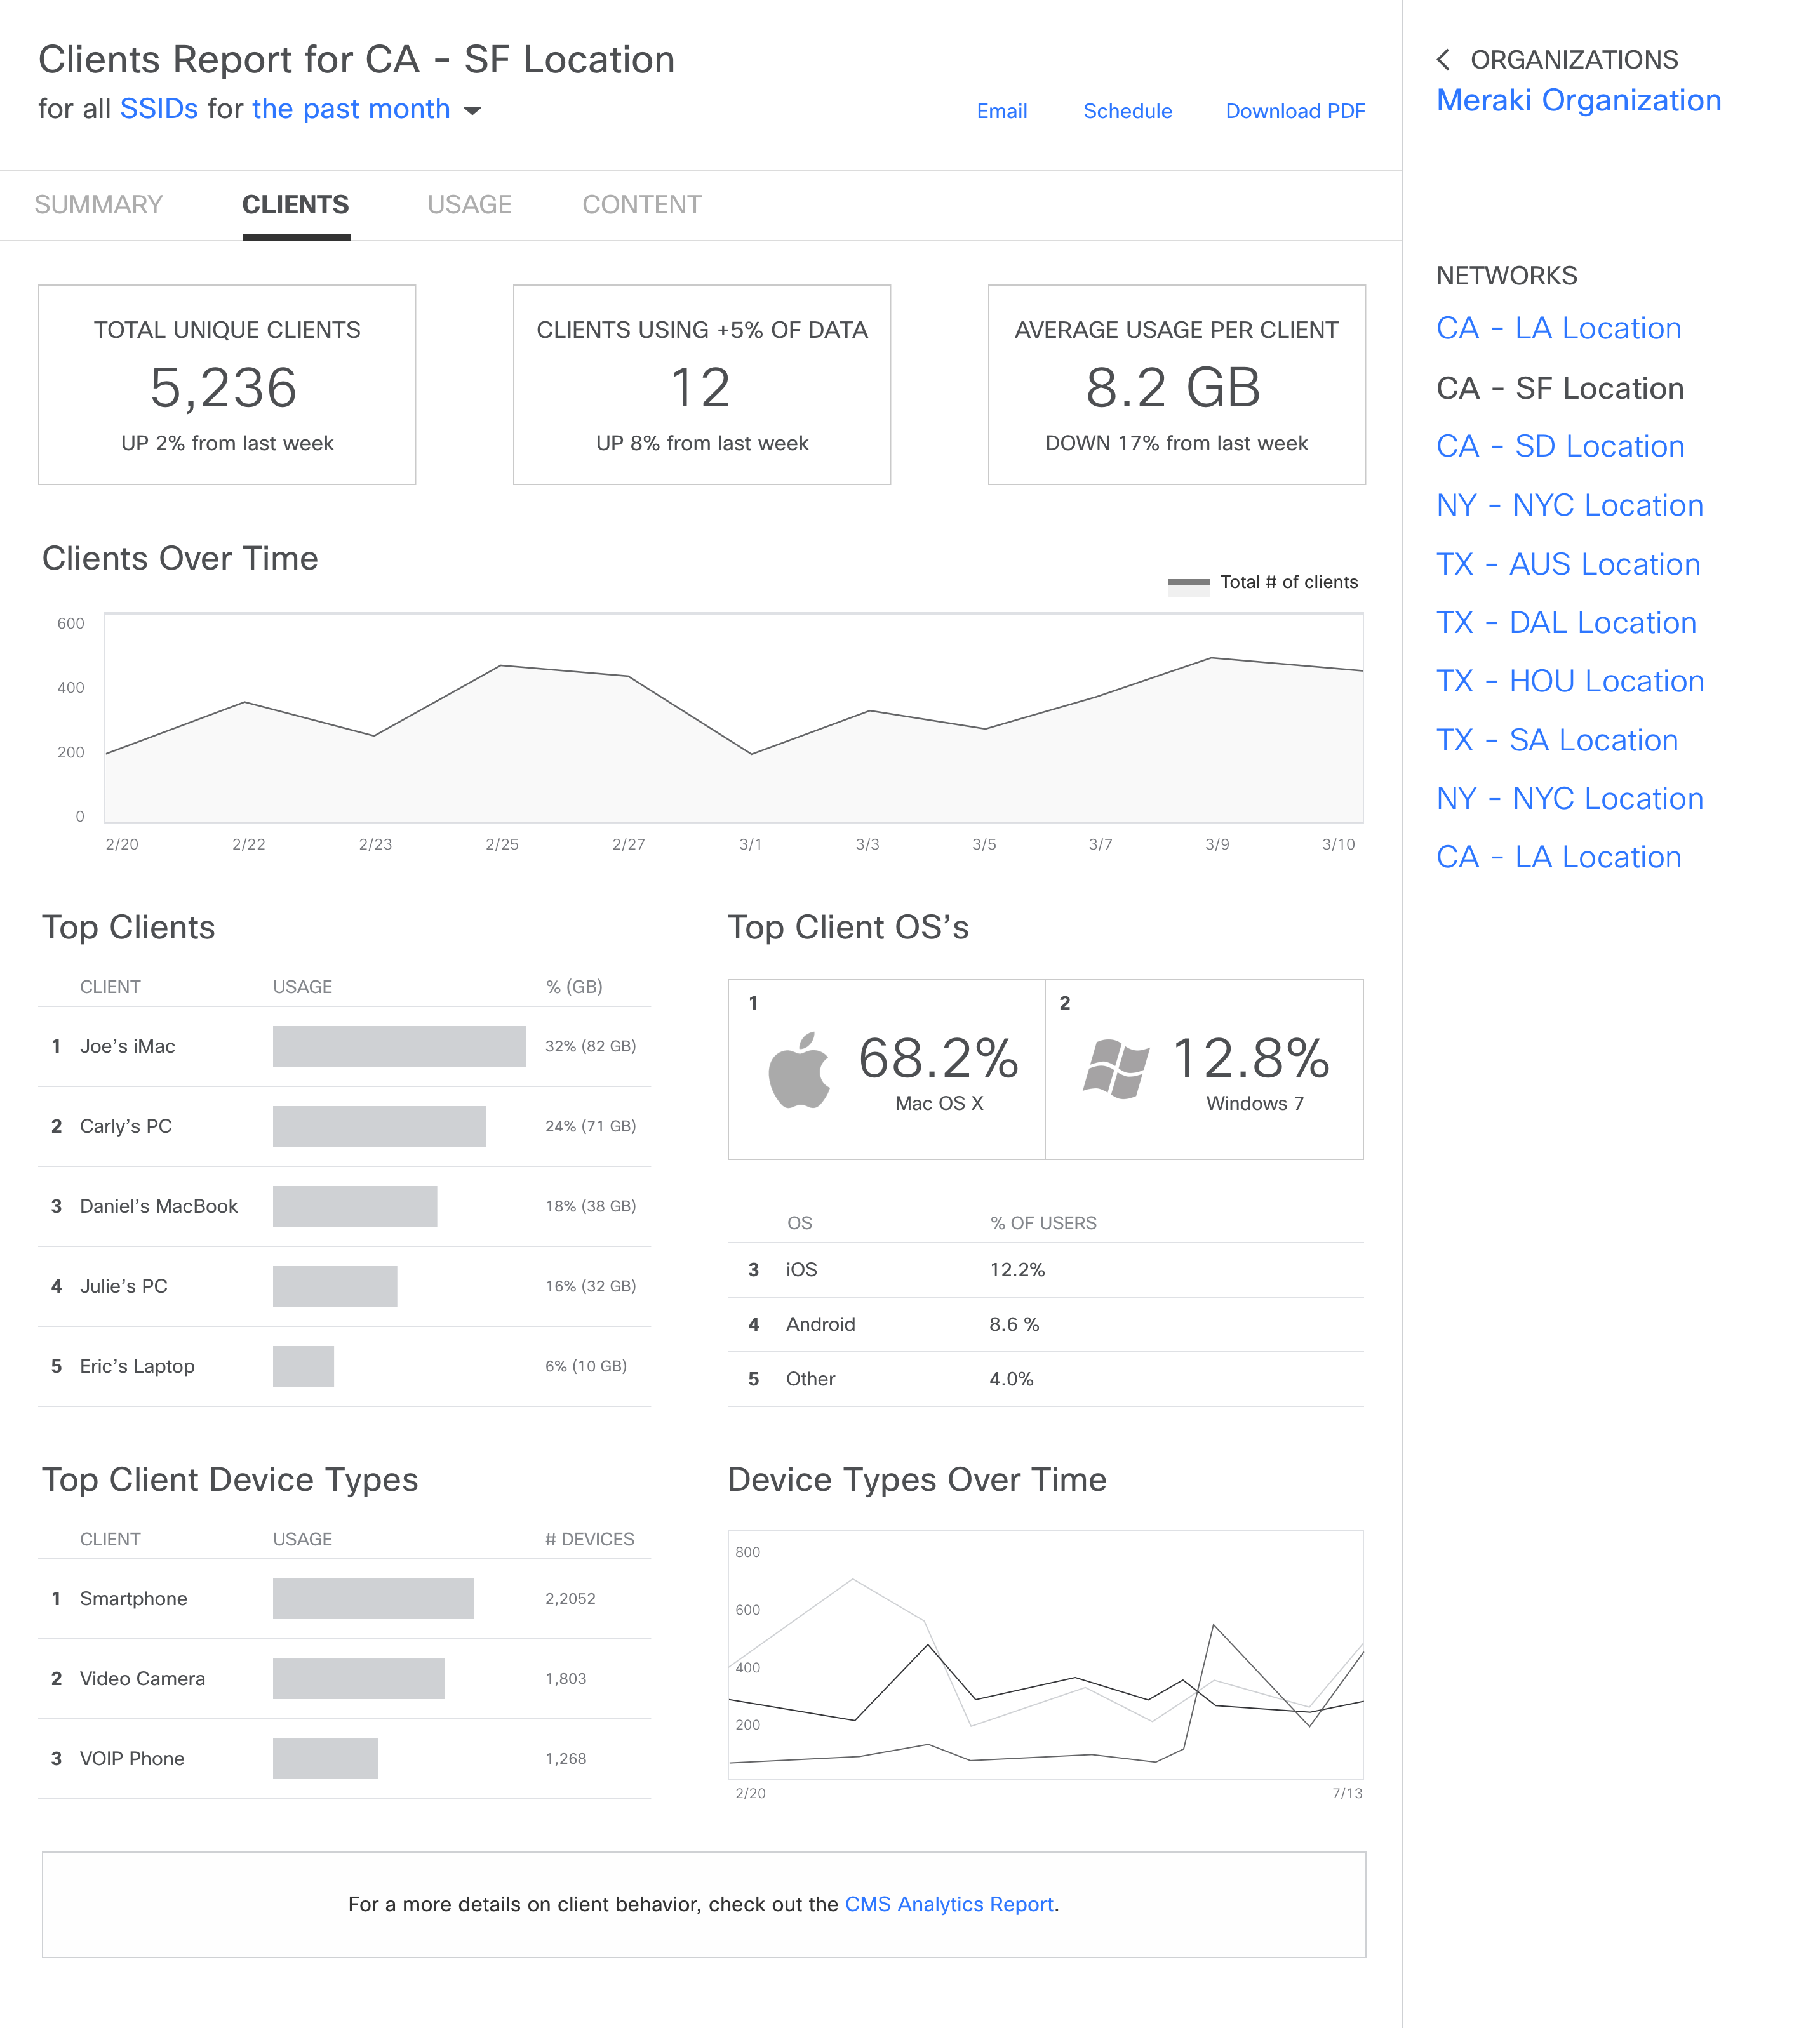
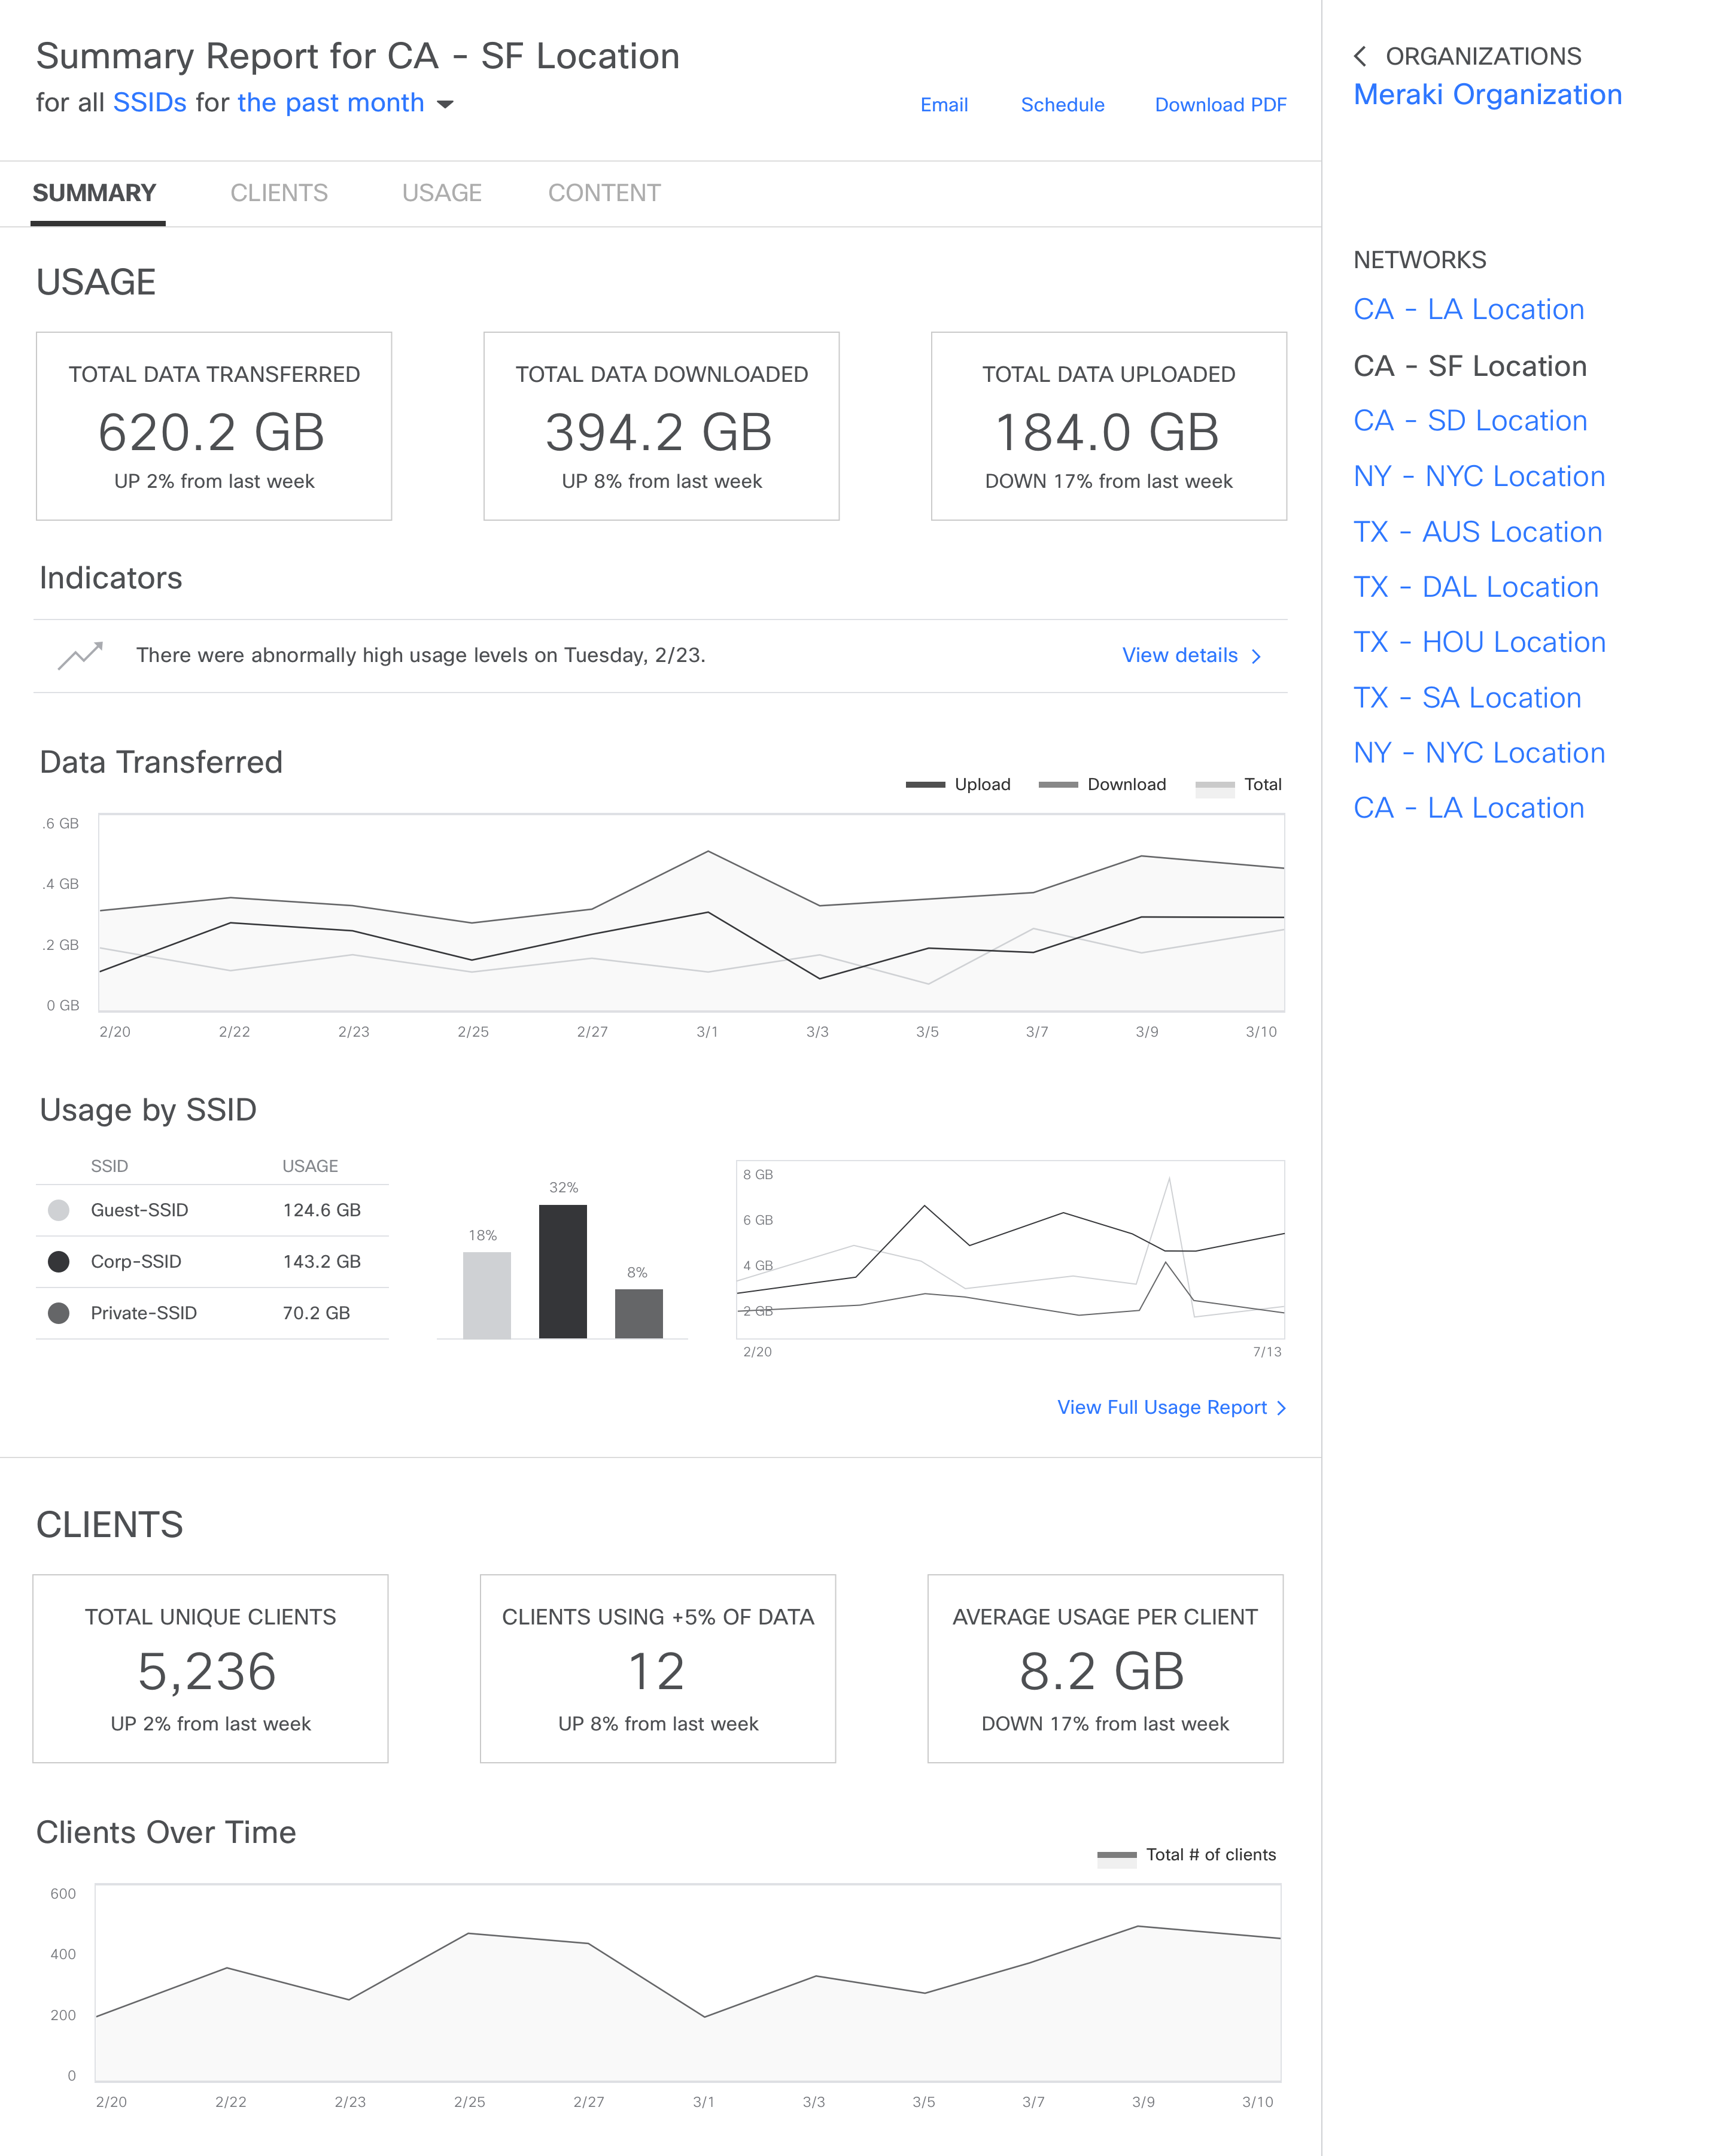
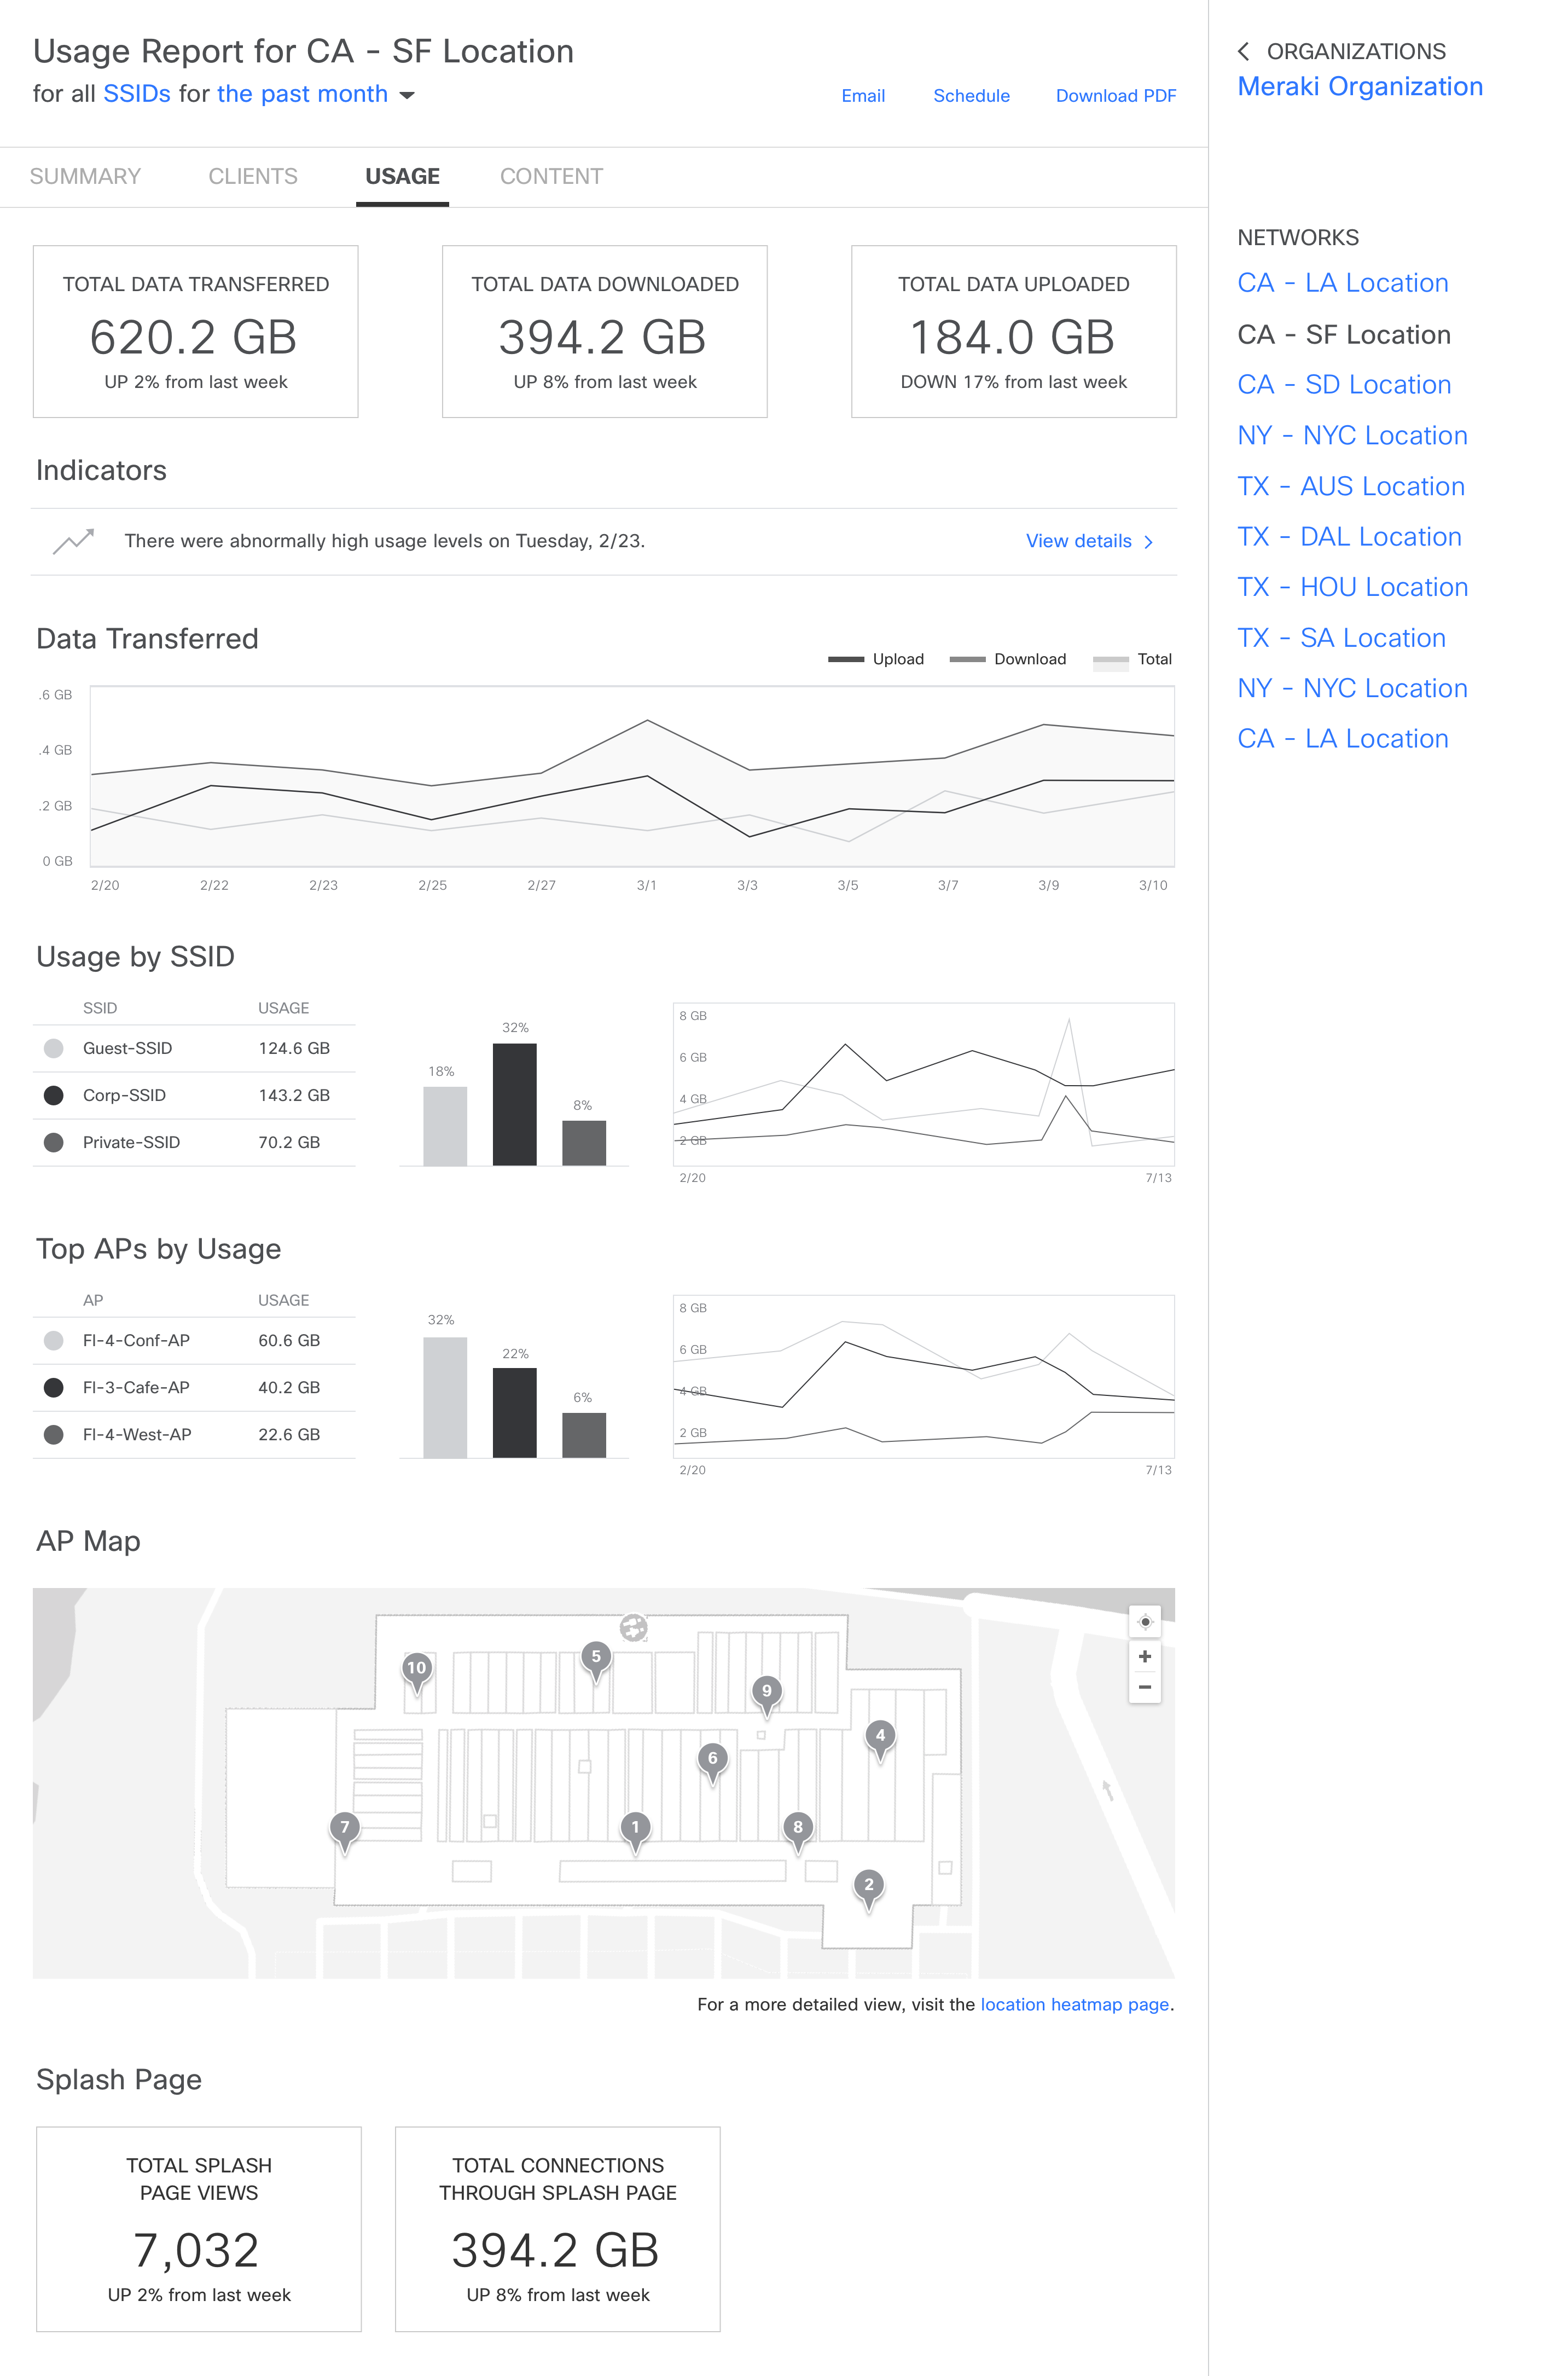
In the first iteration, I wanted to test an assumption that users categorize the data as usage, clients and applications. Rather than adding more metrics, I took the existing content on the page and organized it into the three segments.
Iteration 2
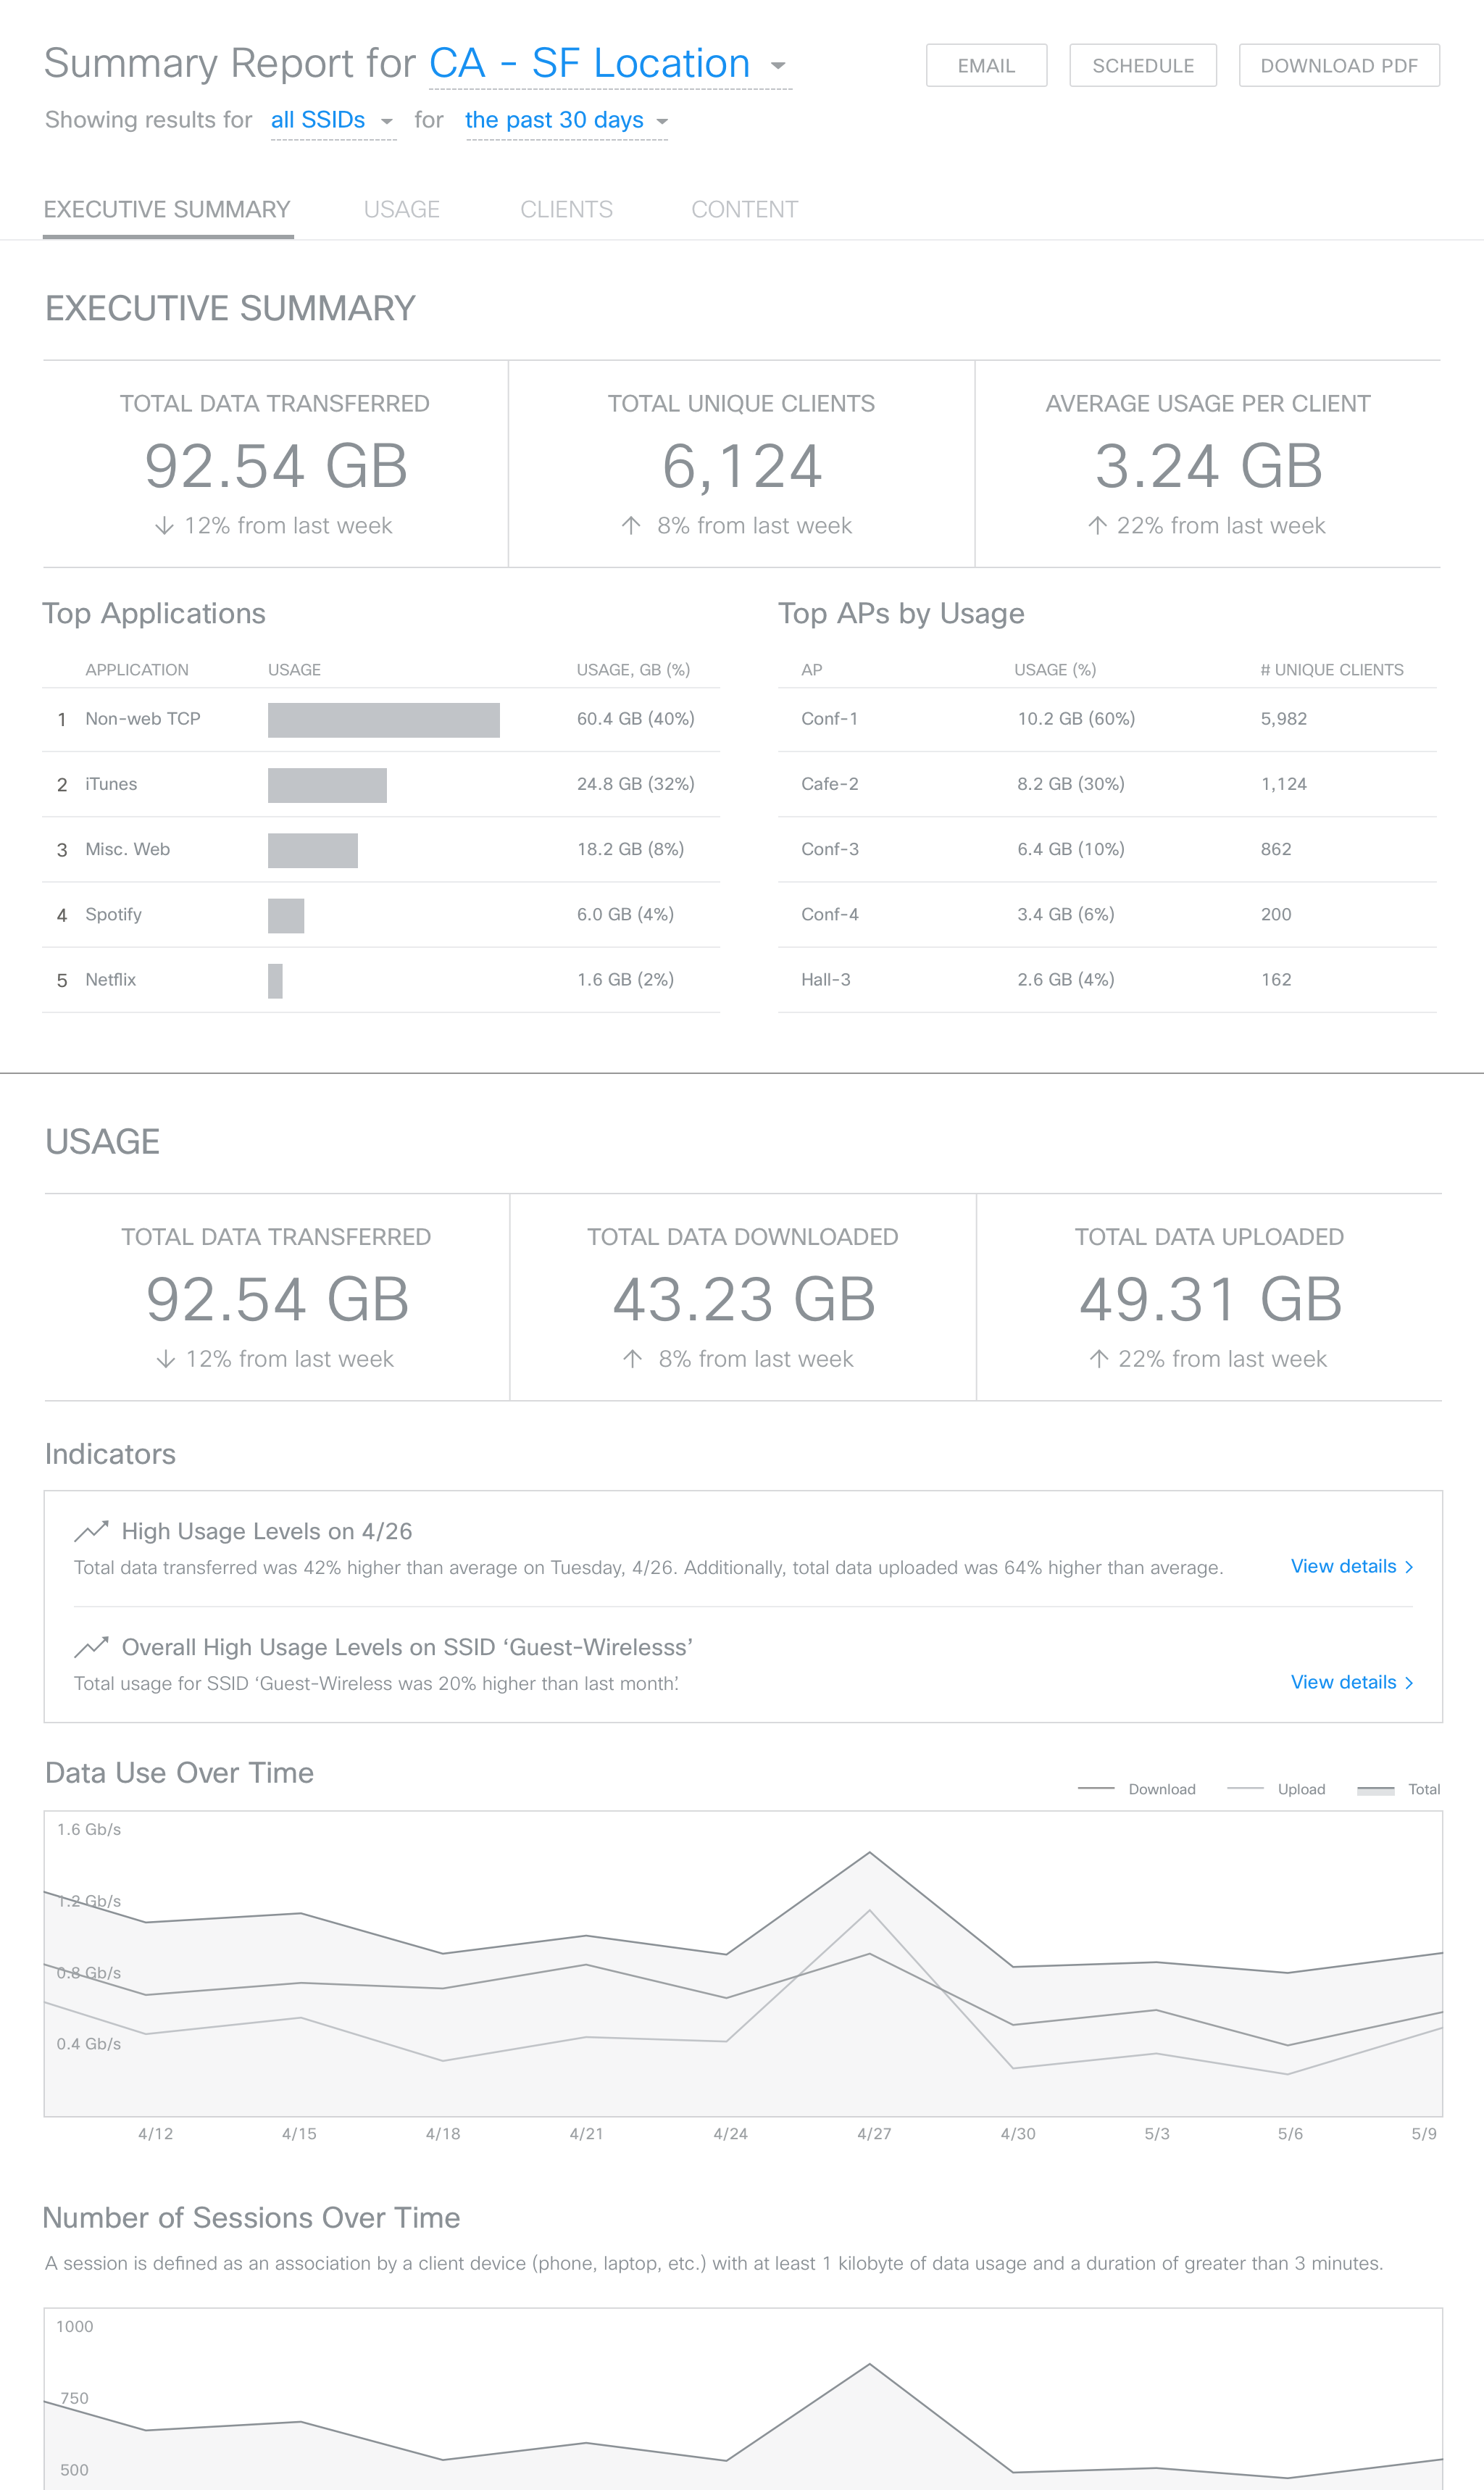
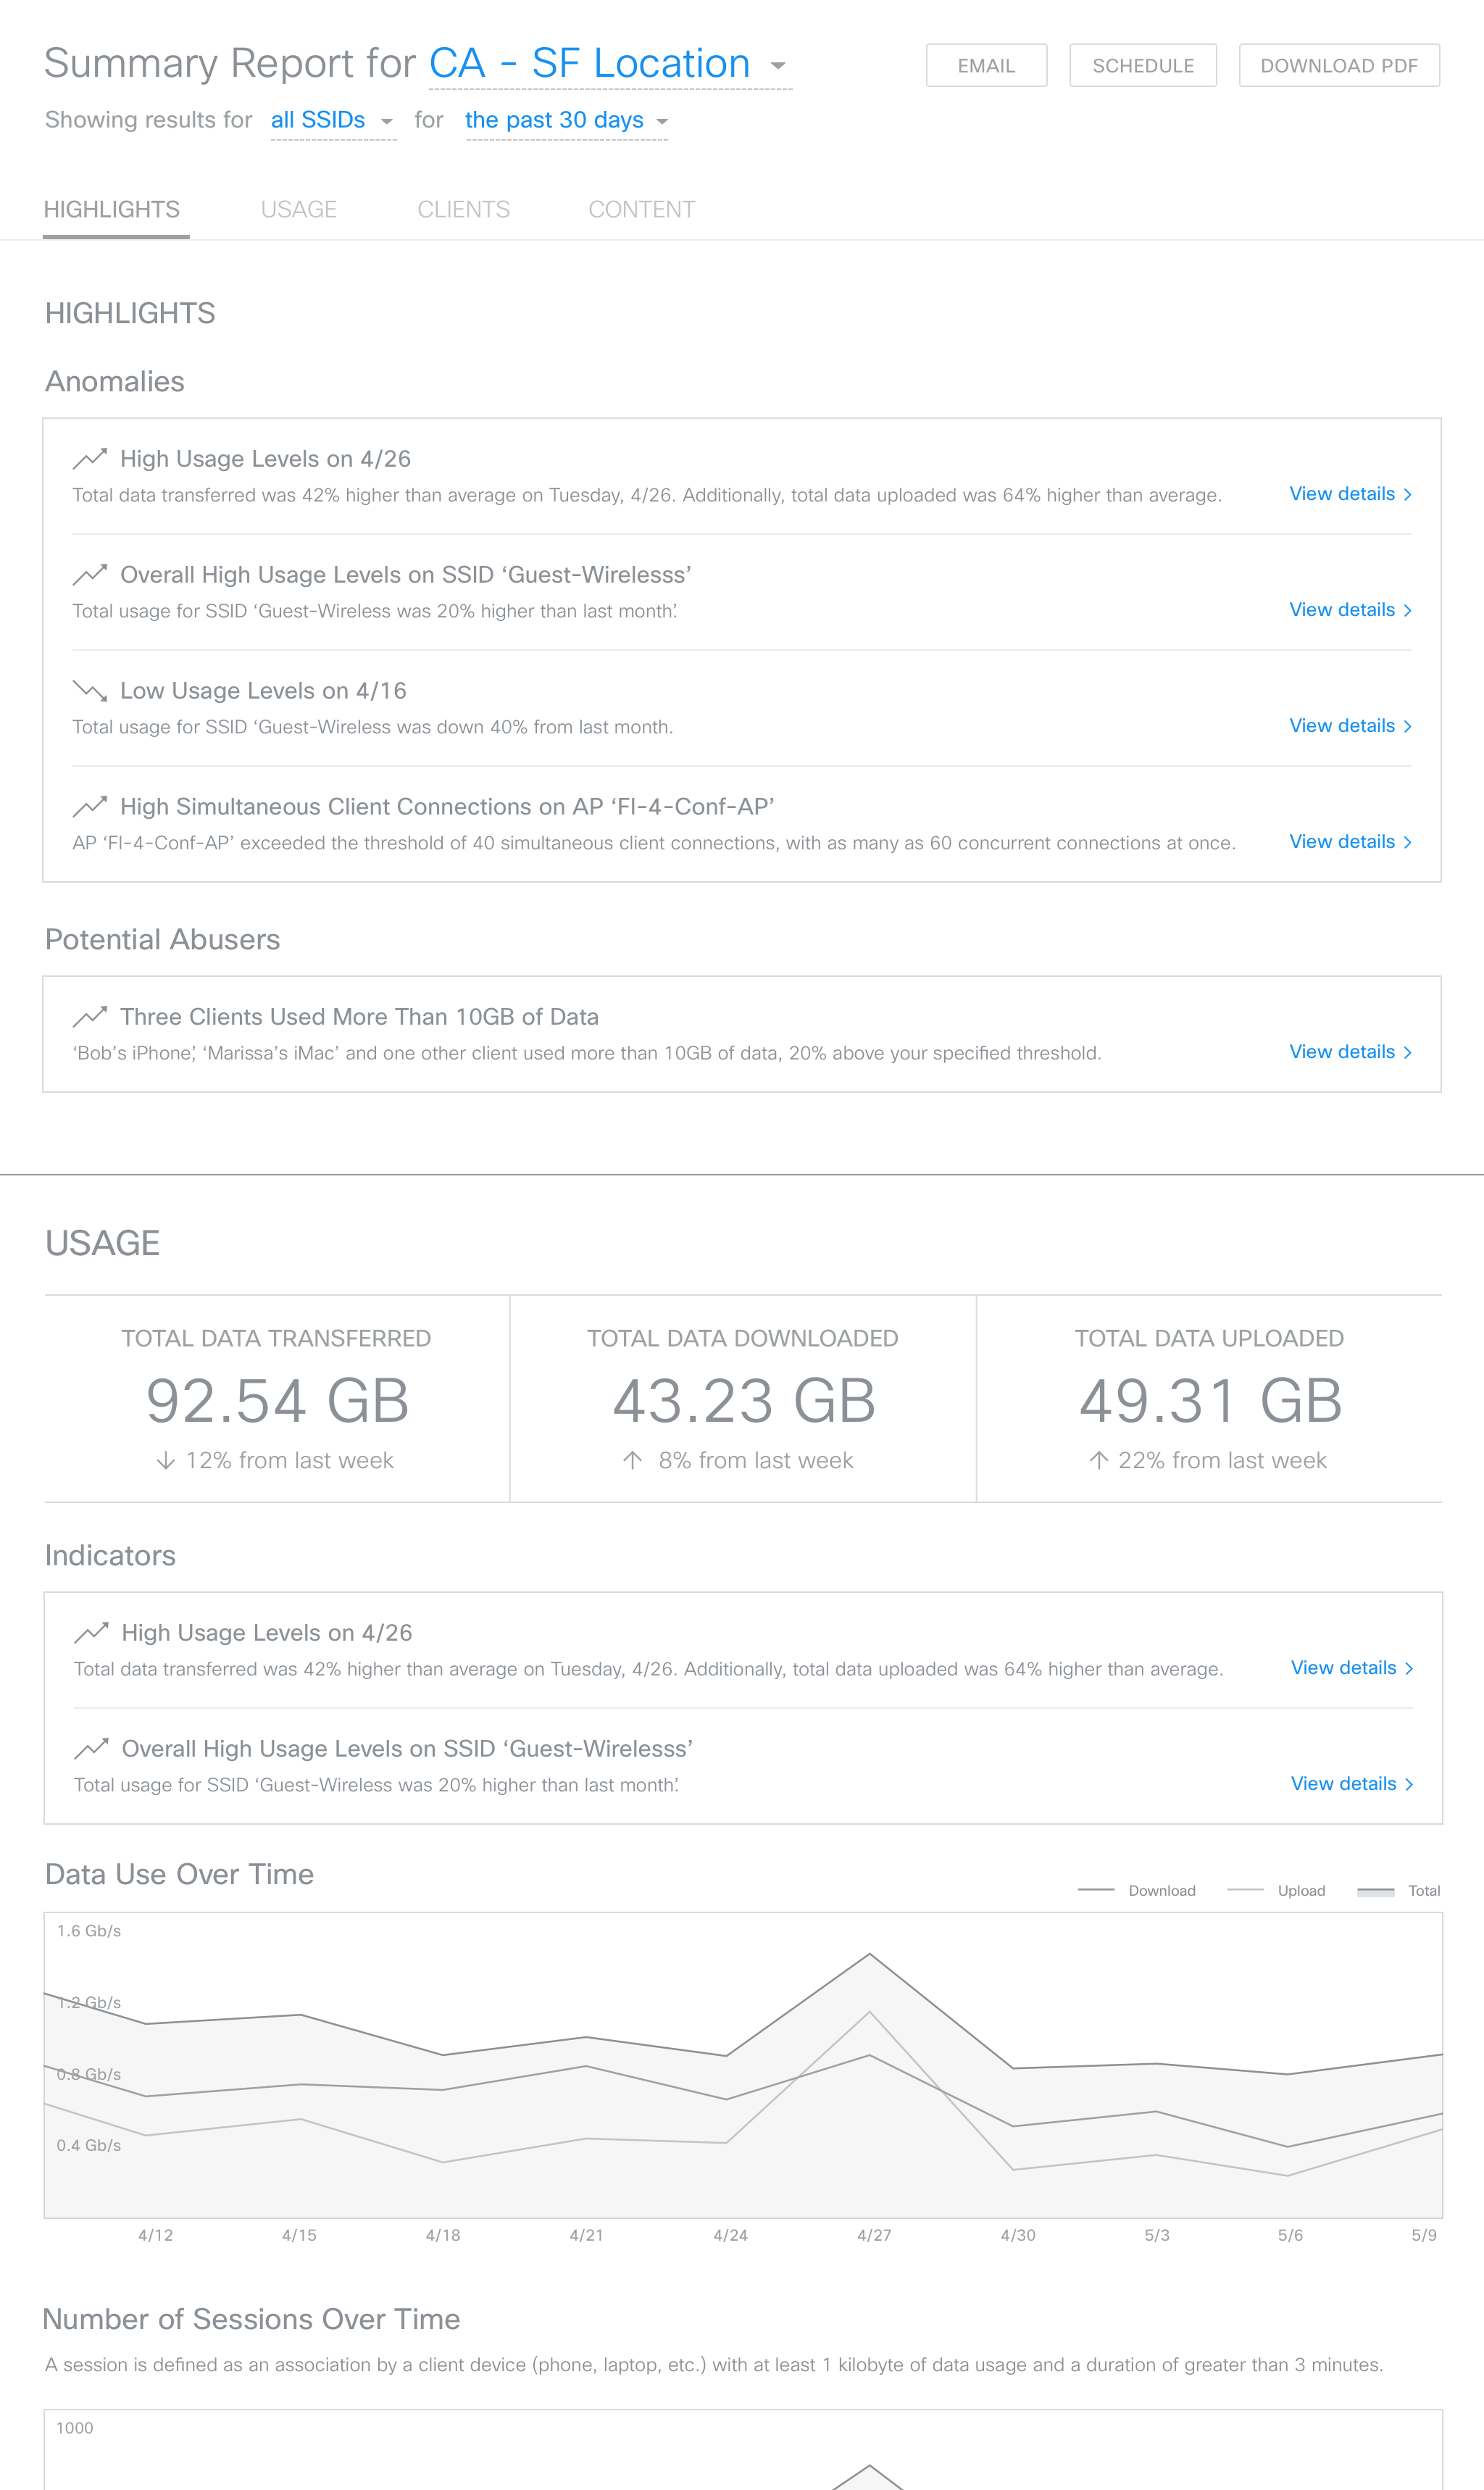
During the second round of user testing, I learned that users aren't only interested in spotting peaks or valleys in graphs, but also want to understand how their network is performing based on historical data. In this iteration, I explored ways to show data trends through anomalies. For example, if usage for a client device is abnormally high, an alert could be triggered that also provides relevant data for the user to dig into if they're interested.
Summary Report
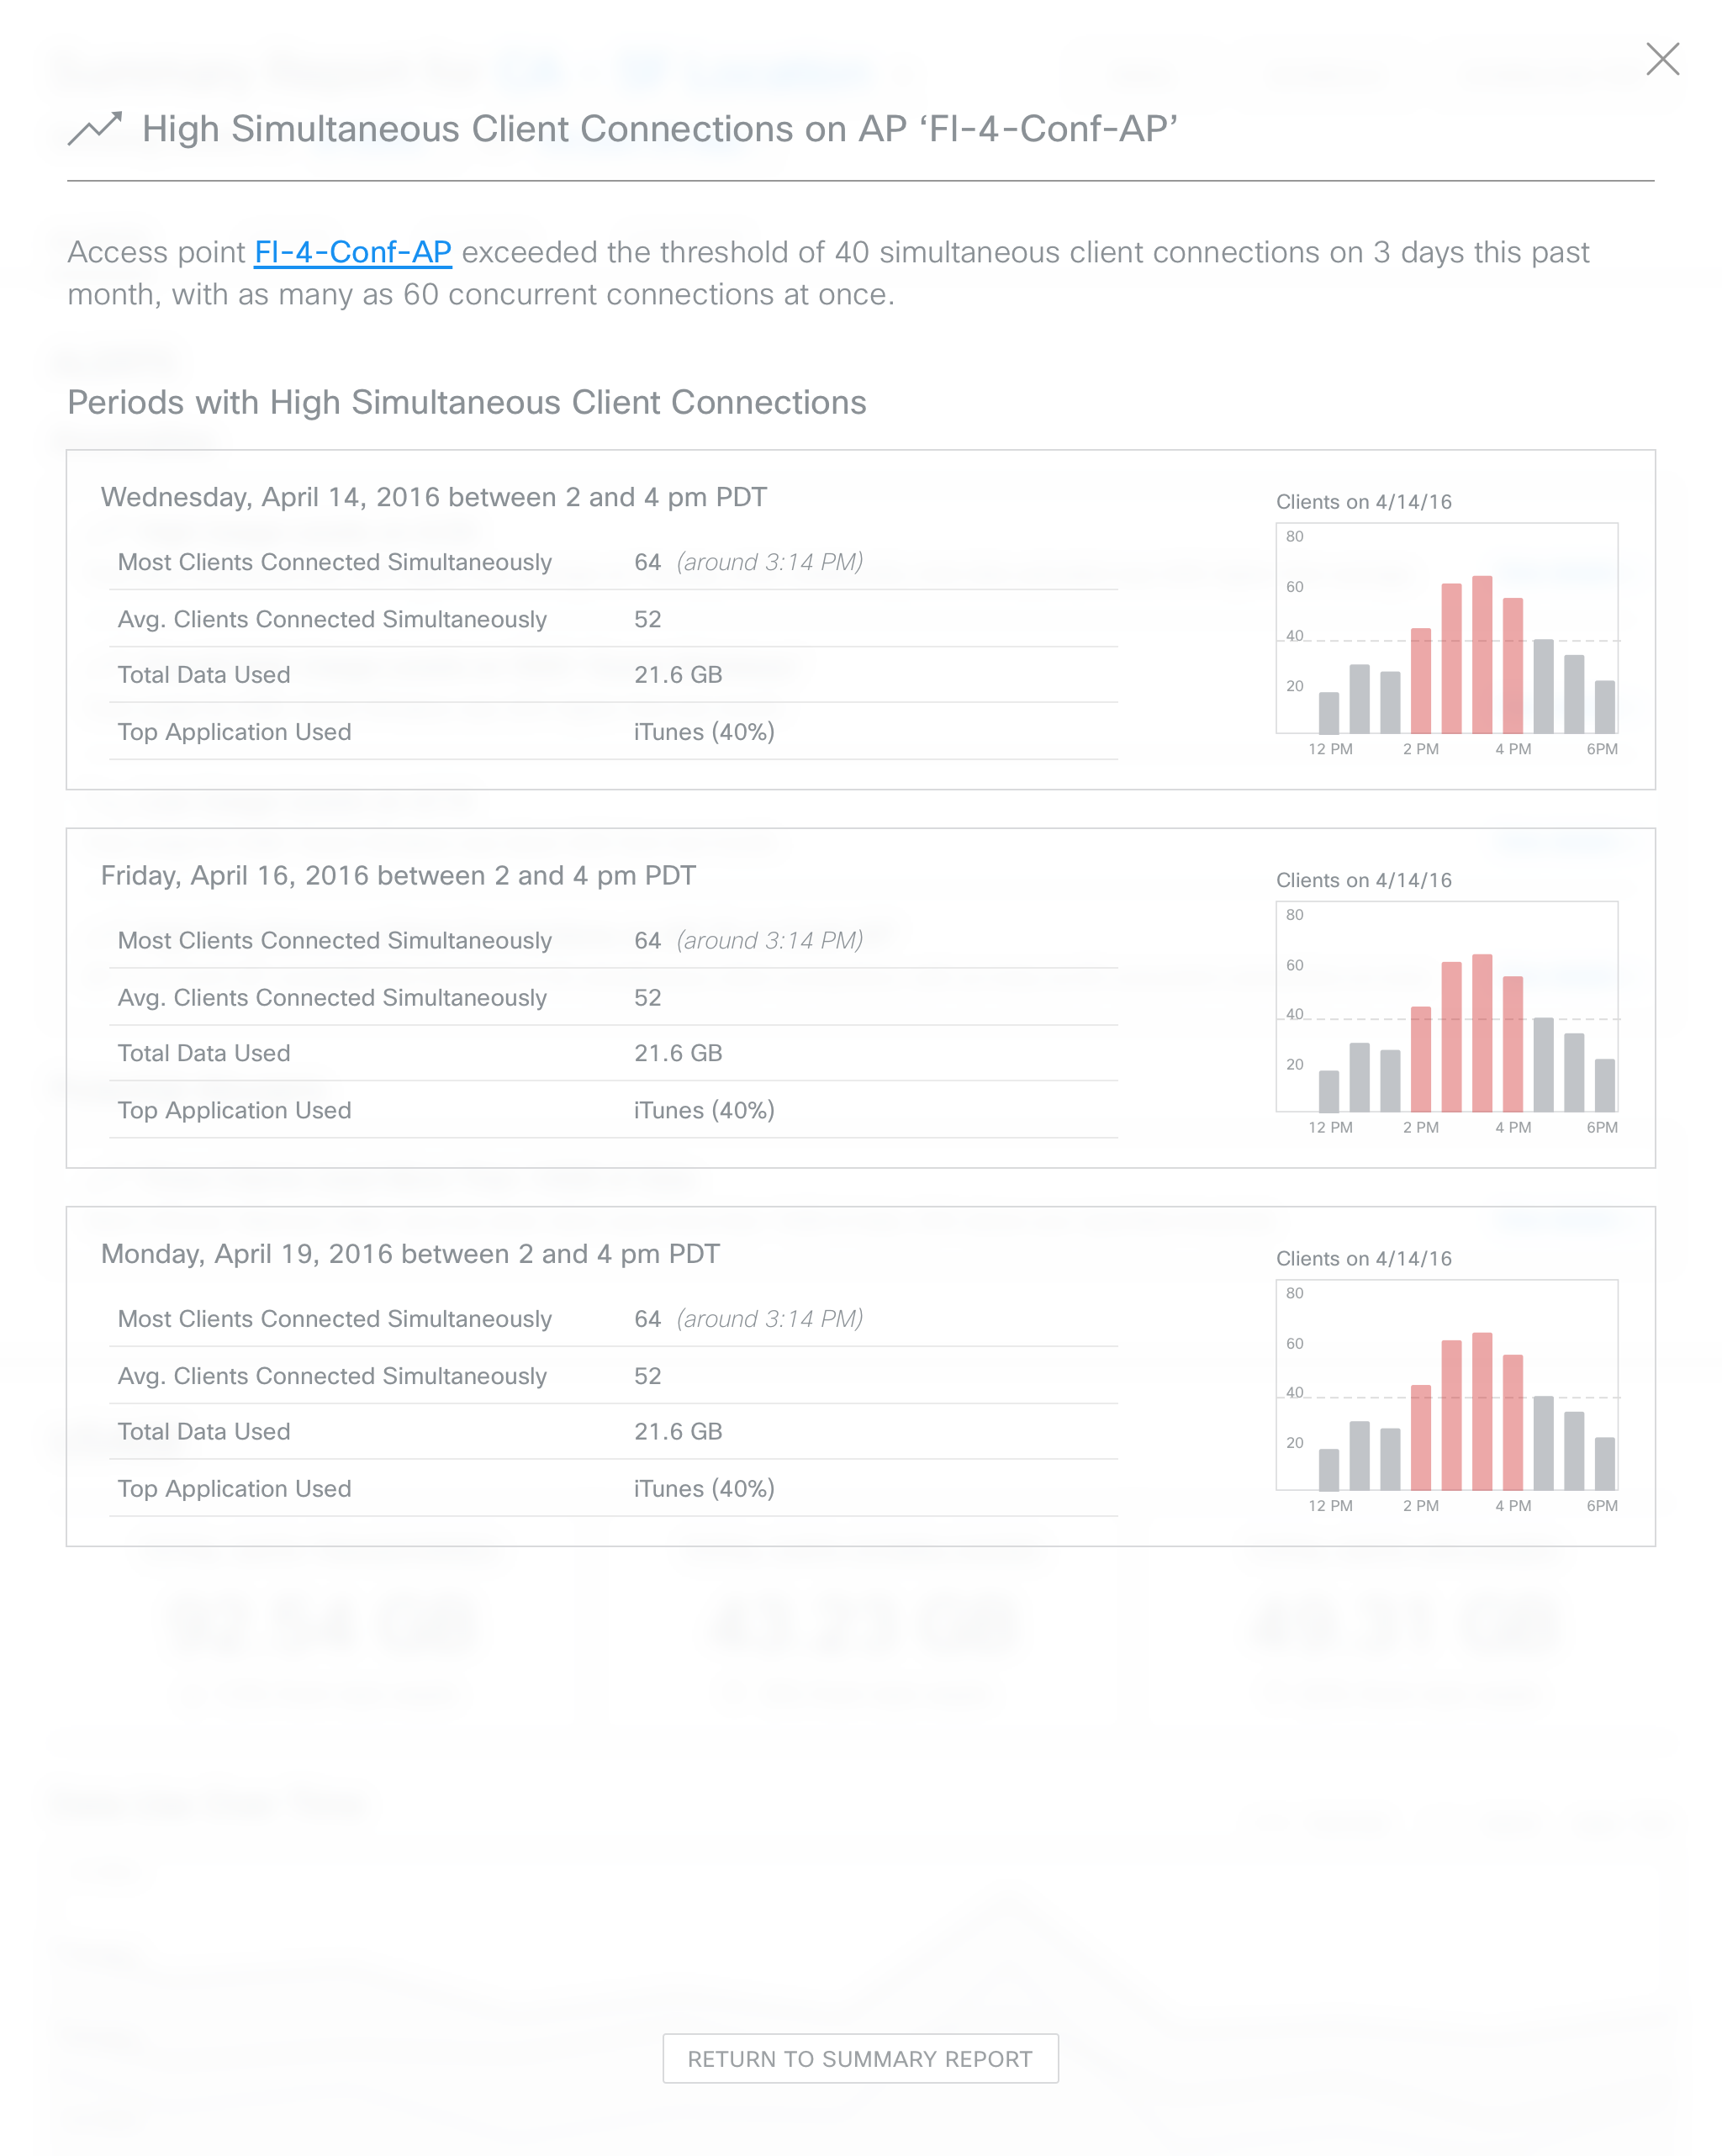
Anomalies
Anomalies monitor an organization's network in real-time, proactively alerting IT professionals to any abnormal behavior, with recommendations on how to resolve or optimize issues.